Summary
Updated Repository
Medium Story
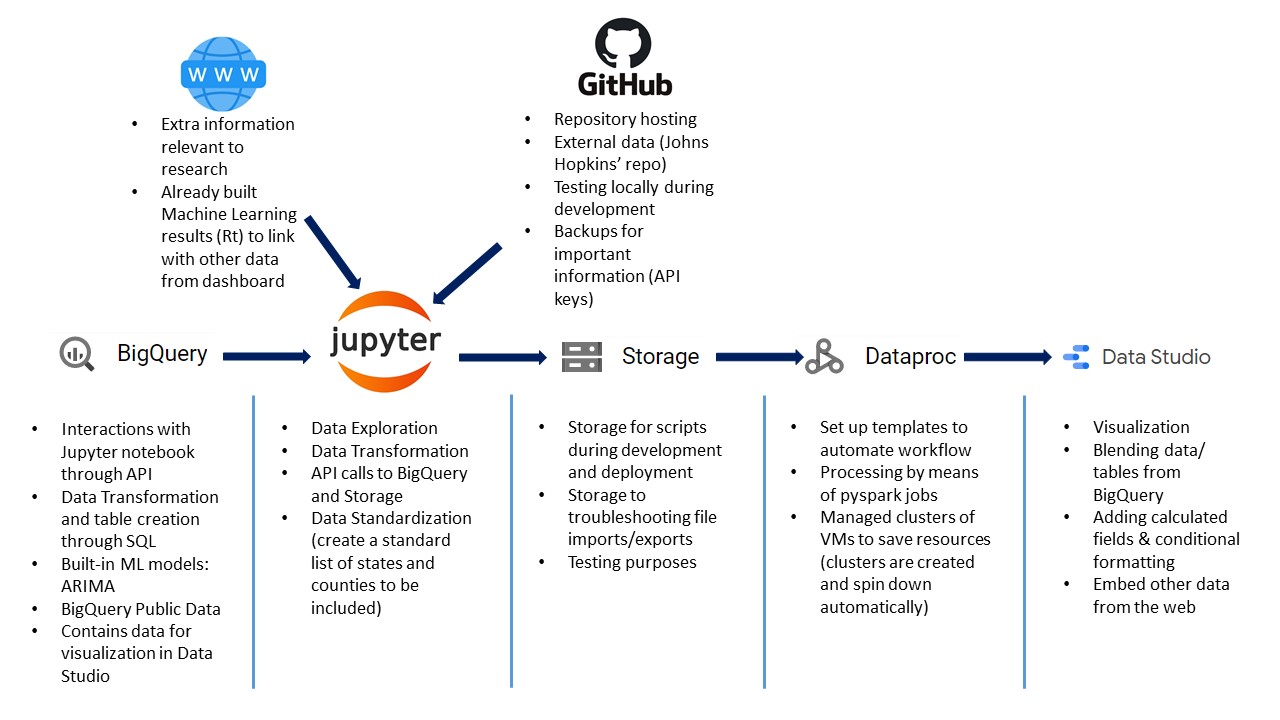
Building on top of the knowledge gained about ARIMA & Rt from the past hackathon with other Hult students, I wanted to learn more about the advantages that Google Cloud Platform could offer. This project involves:
- Fully designing the data pipeline from EXTRACT (from external sources and within the GCP platform) to TRANSFORM (using queries in BigQuery, pandas & APIs) to LOAD (linking/blending tables for visualization in Data Studio)
- Utilizing the managed cluster workflow to spin up a cluster, process tasks and automatically spin down the cluster to save resources
- Incorporate an ARIMA model to forecast the number of confirmed and deaths cases in 50 states
Data Pipeline Process
Lumiata (Hackathon)
Original Repository
A group of Hult students explore and built an ARIMA & Rt model using Python for a hackathon
Insights
We predict how many confirmed cases is going to appeer in each county in the next 7 days using the ARIMA model we forecast new cases in the coming week. The ARIMA model works by finding a linear regression based on the time series previous timelags (AR, auto-regression). To make the time series stationary we need to differentiate it (I, integrated). It also looks at the moving average (MA) when forecasting. We use a gridsearch function to find the appropriate orders for each county.
-
01 According to our calculated Rt
According to our calculated Rt, as of 04.30.20, the pandemic is dying out in San Francisco, with an Rt below 1.
-
02 Counties with the highest prediction
The five counties with the highest predicted new cases over the next week, from 04.30.20, are:
New York City, New York, 19077
Cook, Illinois, 11186
Los Angeles, California, 6642
Philadelphia, Pennsylvania, 3484
Middlesex, Massachusetts, 3435